How to Tell Which Marketing Channel is Making You Money

Does your organization know which digital channels make the biggest impact during the conversion process? Is social media worth the time you’re putting into it? Should you shutter your monthly newsletter and focus elsewhere?
Answering questions like these are (kinda) easy with Google Analytics Multi-Channel Funnels reports. These let you dig into your website’s conversions and find out how much each of digital marketing efforts are paying off. Now, there are a ton of caveats to this, but it is generally true!
So, let’s take a quick look at what multi-channel reporting is and how you can use it to qualify your marketing efforts.
What are multi-channel funnels?
Multi-channel funnels allow you to attribute percentages of a lead to different marketing channels the lead was exposed to. For online efforts, Multi-Channel Attribution, Across Digital Channels (MCA-ADC) is the way to go (and what Google Analytics offers).
Which source would you credit with the following lead?
- An individual finds your website by searching for “public speakers”.
- Three weeks later, the same individual searches your brand name on YouTube to view videos about hiring public speakers for small to medium conferences.
- Two weeks later, the same individual clicks on an ad in Google and then fills out your contact form.
The marketing channel (i.e. organic search, social media, paid media) that deserves credit for the conversion is… all of them (maybe)!
Using a multi-channel report like MCA-ADC will assign weight to each interaction, allowing you to gain more insight into the visitor’s journey to conversion.
What can you do with this data?
Identify high performing channels.
Multi-channel reporting allows you to see which marketing channels assisted with your conversions. This helps you understand which channels work well together and which ones may be deserving of more effort.

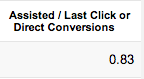 To get started with this, you can click into the “Assisted Conversions” report under “Multi-Channel Funnels” in Google Analytics. This report tells you which channels registered a visit prior to the converting visit. The “Assisted / Last Click or Direct Conversions” column tells you the propensity of a channel to drive conversions. The lower the number here, the better. So, if you have anything in this column that’s less than one, that’s great!
You can adjust the timespan used to generate the reports at the top in the “Lookback Window”. The default is set for 30 days. So, if your sales cycle is longer than a month, you can take the window all the way back to 90 days, crediting interactions from months prior to the conversion.
Time your campaigns.

So, if you notice that paid advertising is almost always the first interaction for converting visitors, you’ll know to start those campaigns early. Similarly, you may discover that email is a good closer, so you’ll be sure to always include an email with each campaign you run.
Another report to check out is the “Time Lag” report. Here, you’ll want to use the built-in conversion segments for multi-channel reports. By clicking on one of the pre-defined traffic segments, you can find out information like the average time between first interaction with a channel and a conversion. The “Path Length” report is similarly useful, showing the number of additional interactions before a conversion registered.
How are the multi-channel reports generated?
The way you attribute those percentages can vary depending on the model used. Google Analytics (and virtually all other analytics platforms) use a “Last Interaction” model. Within Google Analytics, however, you can run a model comparison to see if a different model would more accurately reflect each channels impact for your business’s conversions:
- Last Interaction – Attributes ALL of a conversion to the last channel the user interacted with. This is how most reports attribute conversions.
- Last Non-Direct Click – Ignores direct visits and attributes ALL of a conversion to the last channel the user interacted with.
- Last AdWords Click – Attributes ALL of a conversion to the AdWords ad that was last clicked.
- First Interaction – Attributes ALL of a conversion to the first channel a user interacted with.
- Linear – Gives EQUAL credit to all channels interacted with prior to the conversion.
- Time Decay – Heavily credits channel interactions at the tail-end of the conversion.
- Position Based – Heavily weights first and last interaction with minor credit going to interactions in the middle.
- Customized – Specify your own weighting per channel.
What channels are measured?
Google Analytics automatically buckets your data into certain channels. You can edit the default setup or create your own.
The default channels groupings in Google Analytics for these reports are populated as follows:
- Display
- Anything with medium of “display” or “cpm”. For AdWords, it’s any ads set to “content” and excluding “text” formats.
- Paid Search
- Anything from AdWords Search or other search engines with a medium of “cpc” or “ppc”.
- Other Advertising
- Anything with medium of “cpc”, “ppc”, “cpm”, “cpv”, “cpa”, “cpp”, “content-text”, “affiliate”.
- Organic Search
- Anything from search engines with a medium set to “organic” that is not classified as paid.
- Social Network
- Anything non-paid from the 400 social networks in the database.
- Referral
- Anything from non-social, non-search websites.
- Anything tagged with a medium of “email”.
- Direct
- Anything from a bookmark or by typing your URL into the browser.
What can I do if the default groupings are incorrect?
If you’re experiencing issues with (not set) traffic in your reports, you’ll need to update your account’s “Default Channel Groupings”.
First, click on (not set) in the report it’s showing up in to see the “Source / Medium” for the data.
Copy the information on the next page and then go into “Channel Grouping” under the “Admin” tab.
Next, click “Actions > Edit” for your “Default Channel Grouping”. Now you’ll need to locate the grouping the data should be showing up under and define it using an “or” rule.
Similarly, if one of your channels seems to have more or less interactions than you’d expect, make sure your visits are being bucketed into the correct channel grouping. Break the report down into “Source / Medium” and then update the default channel definitions like you did in the previous section.
What are you measuring?
Multi-Channel Funnel reporting is based entirely on conversion (i.e. goals). If you haven’t correctly configured your goals for all channels (including AdWords) then you need to start there. And if you’re an ecommerce store running paid ads, setting all of this up is a must!
The other metric that fuels the machine is assisted conversions (i.e. assisted goals). These are interactions prior to the last click. How those are calculated will vary based on the model you’re using.
What MCA-ADC is not.
It’s not a silver bullet. It’s not definitive proof of channel value. It’s not even 100% accurate.
MCA-ADC reporting is one arrow in a marketer’s quiver. It’s a quick way to get an idea of what may be working and where those important interactions are happening.
Get started
Find out more about our conversion optimization services and how we can help you.
Most newsletters suck...
So while we technically have to call this a daily newsletter so people know what it is, it's anything but.
You won't find any 'industry standards' or 'guru best practices' here - only the real stuff that actually moves the needle.
You may be interested in:
What is Google Analytics 4?
July 18, 2022