How to create custom reports in Google Analytics 4

If you’ve taken a look under the hood of GA4, you might be wondering, “Where did my reports go?” The UI has changed quite a bit, and how you create custom reports in GA4 has changed from Universal Analytics as well.
But in my experience as a marketer, it has changed for the better.
I find Google Analytics to be a premier reporting solution. Not only does it come with dozens of built-in reports, but it is chock full of new features and uses machine learning to help you pick up on the patterns that truly affect your bottom line.
So in this piece, I’ll be talking about the GA4 layout, its various features, and how to capitalize on them from a marketer’s point of view. Ultimately, we’ll discuss how to create custom reports in GA4 that your team and executives will love.
Need help with your GA4 instance?
A quick tour of the GA4 reporting interface
I’ll start by saying that I like Google Analytics more than Universal Analytics. While most people are transitioning to GA4 because they feel like they have to, I’m transitioning because GA4 helps me optimize better. Let me show you why.
First, let’s start off on the home screen:
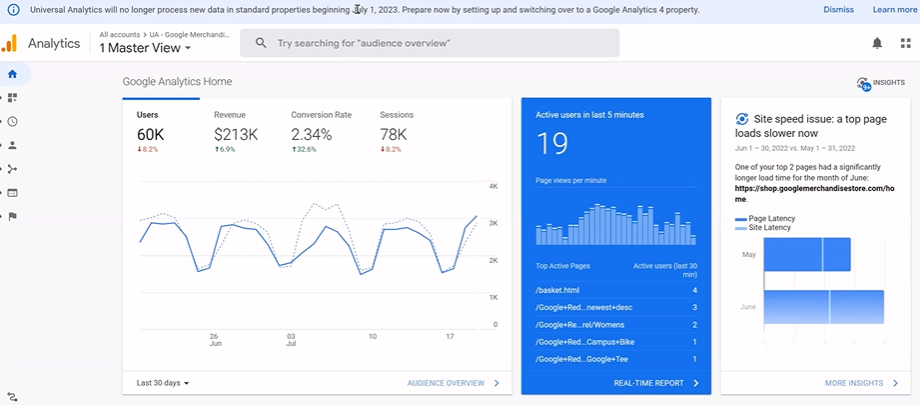
While you’re here, you can toggle back to GA4 or Universal Analytics.
NOTE: If you didn’t transition to the new Universal Analytics by July 2nd, 2022, you won’t be able to see historical year-over-year data.
So let’s dive into GA4, starting with the reporting interface. Here’s a screenshot of what it looks like in my test account:
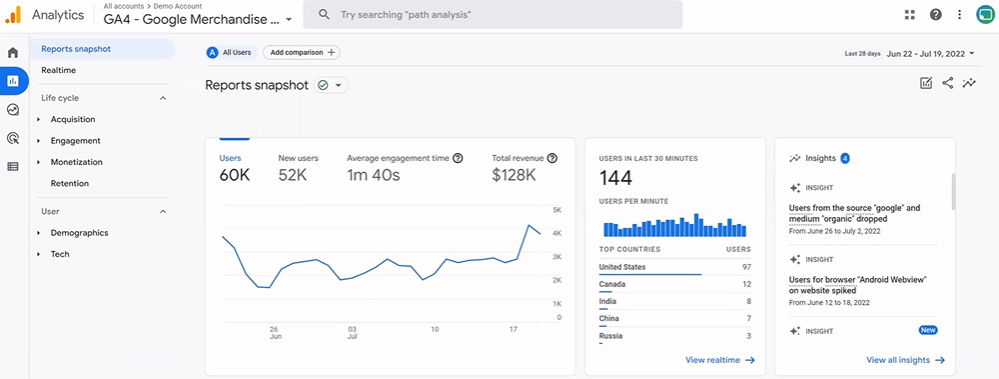
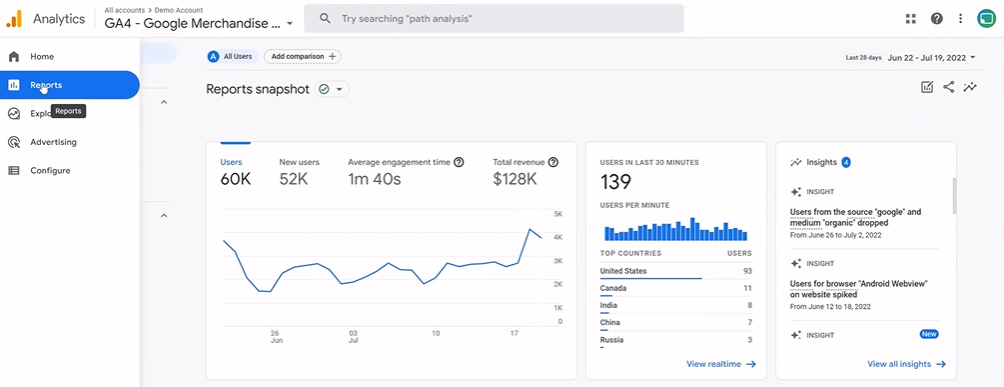
You’ll notice that it doesn’t look that different from UA. However, there are some minor updates to the tabs. In GA4, there are 6 main tabs:
- Reports tab – Where you’ll see your pre-populated reports like you’re used to seeing in Universal Analytics
- Explore tab – Where you can build custom reports
- Home tab – Where you can find what Google thinks are important reports
- Advertising tab – Where you can access your attribution models
- Configure tab – Where developers can make adjustments to events, goals, and audiences
- Admin tab – Backend configuration that looks very similar to the admin panel in Universal Analytics
Virtually everything that exists in Universal Analytics exists in GA4. The sweeping changes people are nervous about mainly apply more to the developer than marketer side of GA4.
When people open GA4 for the first time, they almost always say, “where did the reports go?” And it’s not that they are gone, they are just in a different spot.
Even if you don’t find the report you’re looking for out of the box, you can easily build it in the Explore tab. Explore operates very similarly to Data Studio, and we’ll discuss it in more detail later on in this post.
7 differences between GA4 and Universal Analytics
There are several distinctions between GA4 and Universal Analytics that are important to know before you transition to GA4; namely:
- GA4 is organized differently – Even though there are probably 50% more prepopulated reports in GA4, they are a little harder to find than in UA. To find the reports you’d normally see in UA, click on each “Overview” subtab:
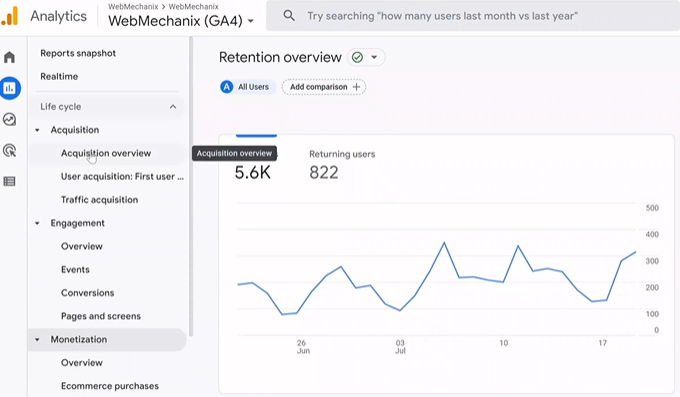
That’s where you’ll see previews of reports you used to see in Universal Analytics.
- GA4 slices and dices data differently – Something to keep in mind is that GA4 can report on the same numbers in different ways. For example, if you click on “Acquisition,” you’ll see two different reports: user acquisition and traffic acquisition.
In the user acquisition report, GA4 examines users’ first channel grouping. So if a user came in through organic search, came back through paid search, and then came back again through display, GA4 only ticks the box for organic search.
Traffic acquisition, on the other hand, only reports by traffic sources. These numbers will always be higher than the user acquisition report. Some users will come back through multiple channels, but GA4 only counts them once in the user acquisition report.
- You can build your own tabs in GA4 – If you want to see a report that’s not listed by default, you can add it to your menu. I recommend that business owners do this because they can see ecommerce customer trends happening in real-time.
- You can create a Report Snapshot in GA4 – GA4 enables users to make giant dashboards showing all the reports they want to see. You can add or remove reports at any time.
- GA4 comes with ML-driven Insights – While Universal Analytics had Insights, they weren’t as AI/ML-driven as they are in GA4. Insights are a direct reflection of what the algorithms are finding. So while you shouldn’t accept all Insights suggestions blindly, you should definitely consider them.
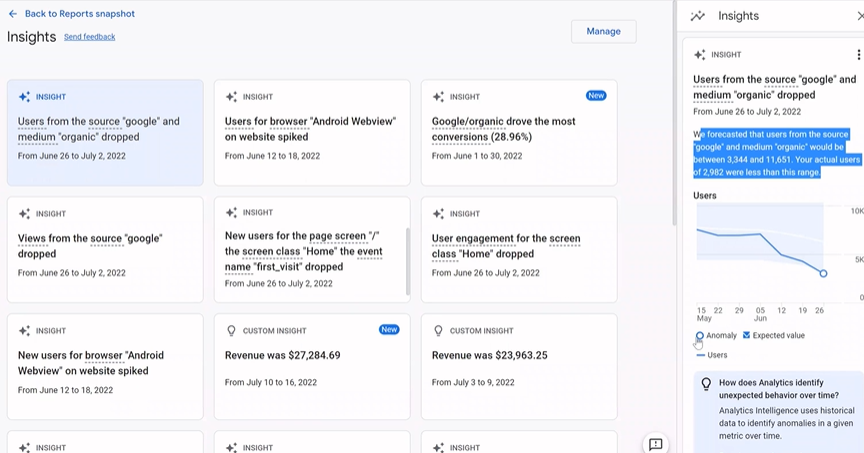
When you click on each Insight In GA4, you’ll get a description of the insight and a graph showing how the model determined it was a true anomaly (see on the right-hand side of the screenshot above).
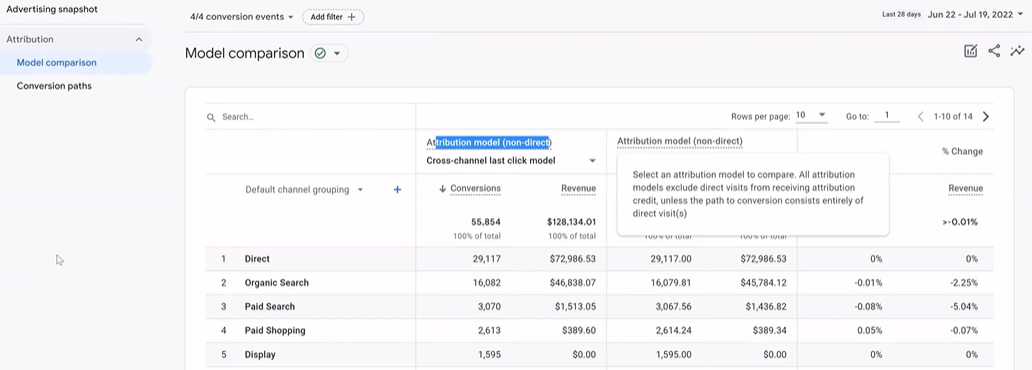
- You can use cross-channel data-driven models in GA4 – Choosing to be cross-channel data-driven means that the model will always attribute conversion to the first place a user was acquired.
That feature was accessible in UA. But in GA4, you can tell Google to split up conversions by how much each channel factored into a user’s chance of conversion. So you’ll actually see decimals in your conversions.
And if you’re curious about the attribution model, I encourage you to go to the Model Comparison subtab of “Attribution” and hover over the model to learn more about it.
You can change the attribution model at any time in the Admin panel (Data Collection → Attribution Settings → Reporting Attribution Model dropdown).
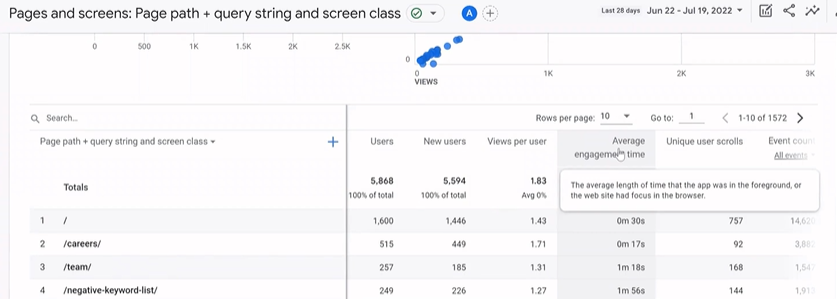
- Tooltips are hidden in GA4 – It may seem like tooltips are gone for good, but GA4 just hid them to streamline the UI. If you hover over a metric, the definition will appear:
How do you build a report in GA4?
The great thing about GA4 is that you can easily build any kind of report you need, and the data is all there. I find the best way to start is by using one of the Exploration templates. To get there, Click Explore on the left-hand menu.
Once you’re there, you’ll see a series of Exploration templates to choose from:
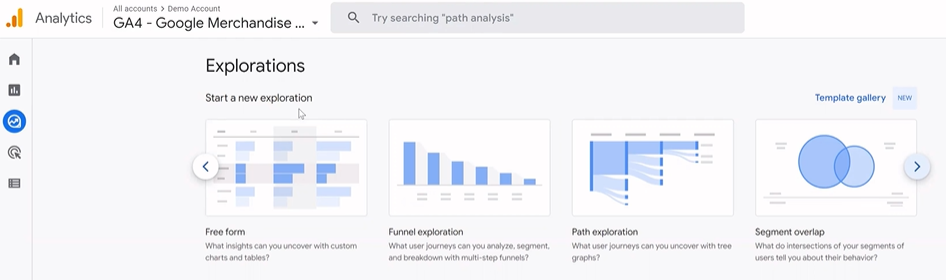
Let’s say I want to look at landing pages by user. To build that report, I would first pick the free form template:
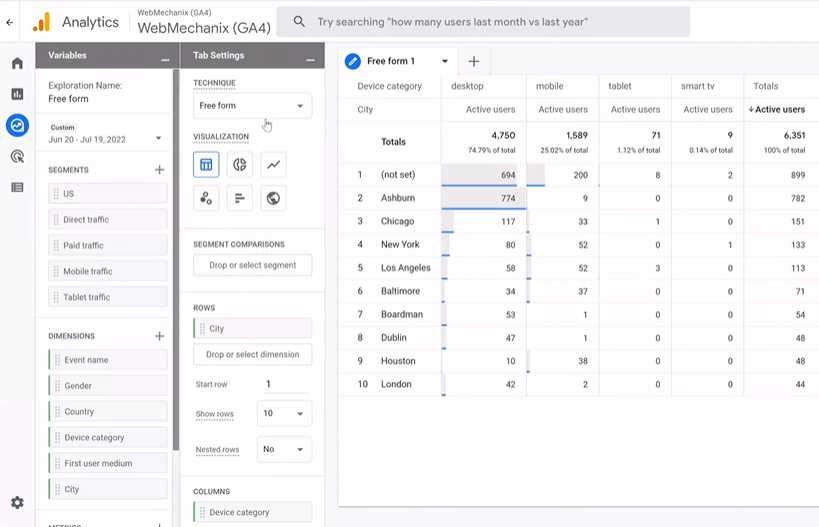
On the left, I see variables to choose from and options for how I want my report to look. Now we’re ready to design the report step-by-step:
- Delete the data from the report – GA4 autopopulates data, but it’s less confusing to start clean.
- Find and add the Landing page dimension – Dimensions are listed in the variables section on the left. However, not all of them are displayed. If you don’t see one, you’ll need to click on the + button to access the expanded menu. Search for “Landing,” and it should appear:
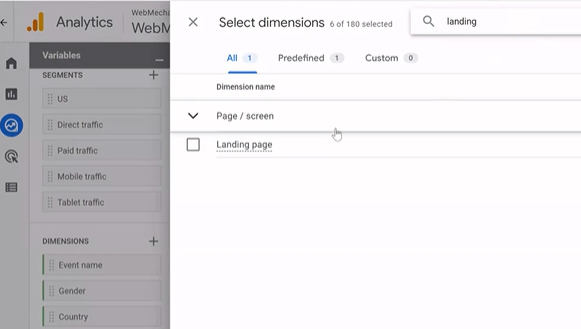
Check the box, click “Import,” and then double-click on the Landing page dimension to add it to your report.
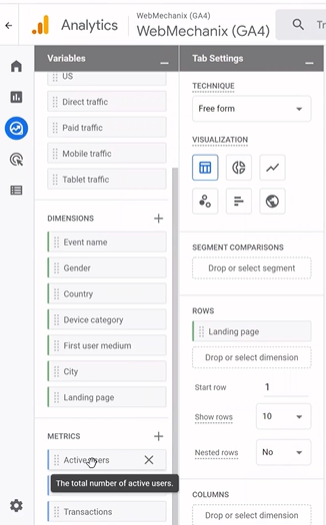
- Find and add the users metric – As a refresher, the difference between dimensions and metrics is that metrics are measured in numbers. Dimensions are typically words. So for instance, “Active Users” is a metric, whereas “Landing page” is a dimension.
Scroll down to the Metrics section of variables and double-click on “Active users” to add it to your report.
- Adjust your settings – In the Tab Settings section, you can change how the data is visualized, compare different segments, or increase or decrease the number of rows you’re looking at. 25 – 50 rows is usually a good choice.
- Take your reporting a step further – In Universal Analytics, you were stuck after step 4. But in GA4, you can break your data down even more.
So let’s say you want to know what devices people use to access individual landing pages. Find “Device category” in the Dimensions section of your variables and double-click. GA4 will automatically know how to represent that data in the most visually appealing way.
If you want to add more columns to get a broader picture, you can drag one of the dimensions or metrics into the Columns section in the Tab Settings and your report will update immediately.
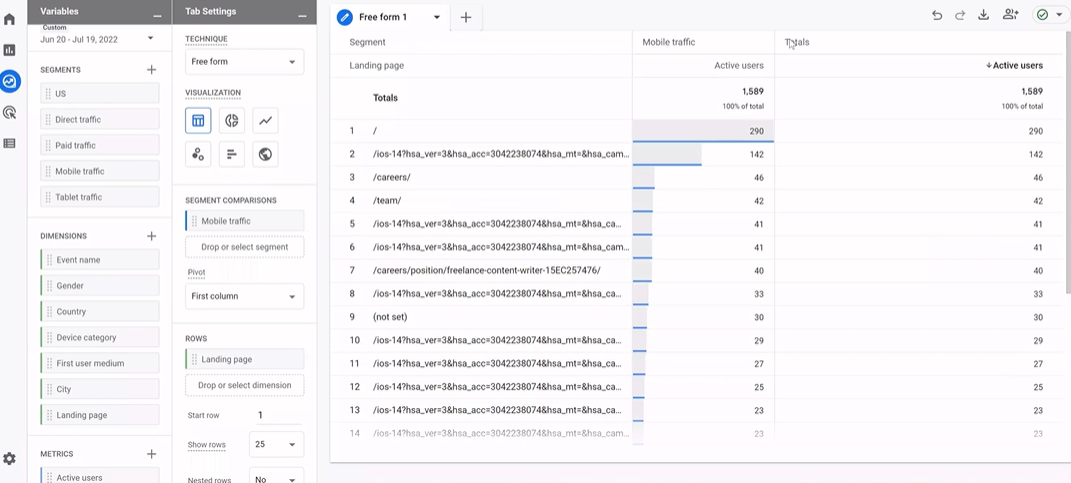
Or, maybe you wanted to look at this data by certain segments. Dragging a segment like “Mobile traffic” into the Segment Comparison Tab settings will just show mobile landing page data. If you don’t already have one set up, you can click the plus sign and create your own based on any variables stored in your instance.
Start building your perfect reports in GA4 today
What I love most about GA4 is that you can create the exact charts you need without complicated dropdowns, user groups, and categories. GA4 also has unparalleled machine learning insights, a cleaner UI, and more flexibility.
And with Universal Analytics going away, marketers and their development teams really have no choice but to implement and adopt it. So why not start now?
If you need a GA4 master to help you out, please reach out to WebMechanix. Or, if you just want more excellent digital marketing tips and tricks, join us at our next Growth Clinic on Wednesday at 12pm ET.
Most newsletters suck...
So while we technically have to call this a daily newsletter so people know what it is, it's anything but.
You won't find any 'industry standards' or 'guru best practices' here - only the real stuff that actually moves the needle.
You may be interested in:

4 Marketing leaders share insights on culture and language
July 7, 2023